
2020-2022 Funding
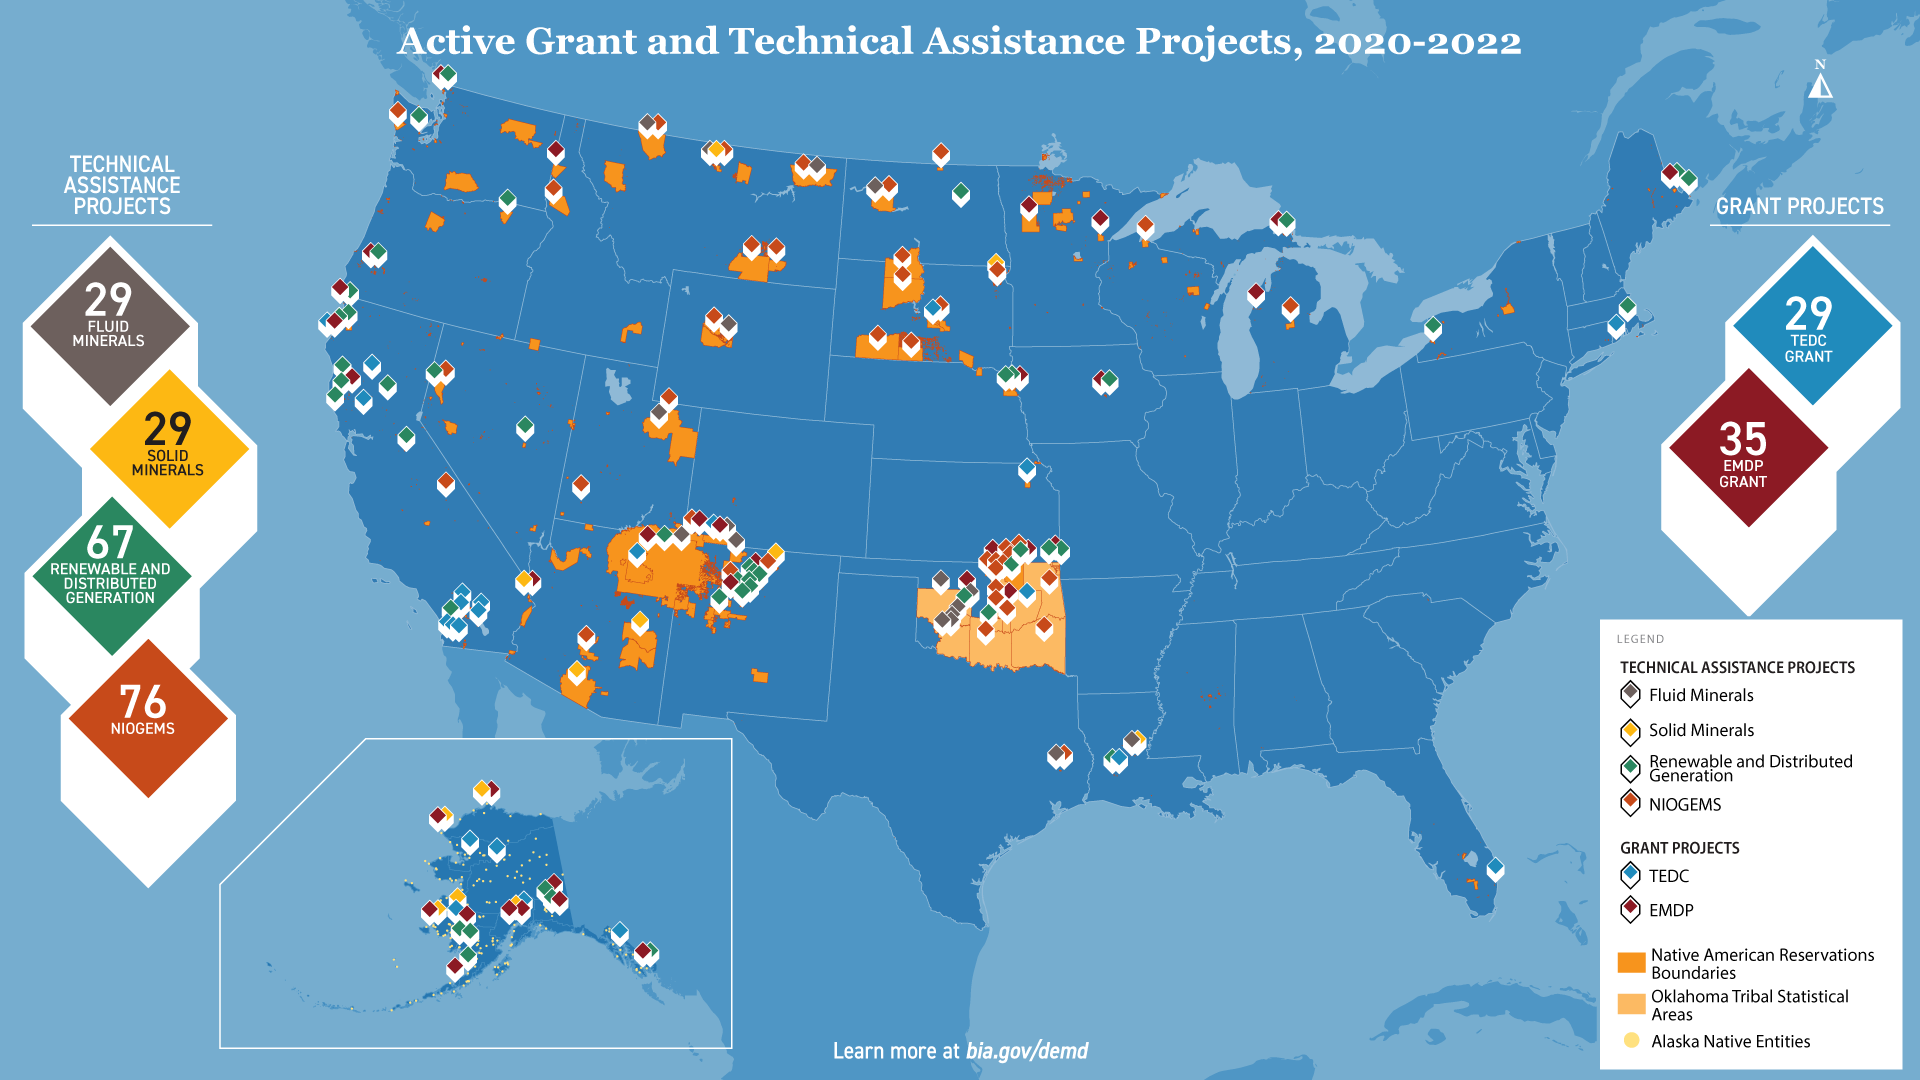
- 265 Active Grant and Technical Assistance Projects
- $8.1 MM in Grants Funded to Tribes
- ~$6 MM Awarded Annually from the Energy and Mineral Development Program (EMDP) Grant
- ~$1.5 MM Awarded Annually from the Tribal Energy Development Capacity (TEDC) Grant
2019 Energy & Mineral Economic Impact on Indian Lands
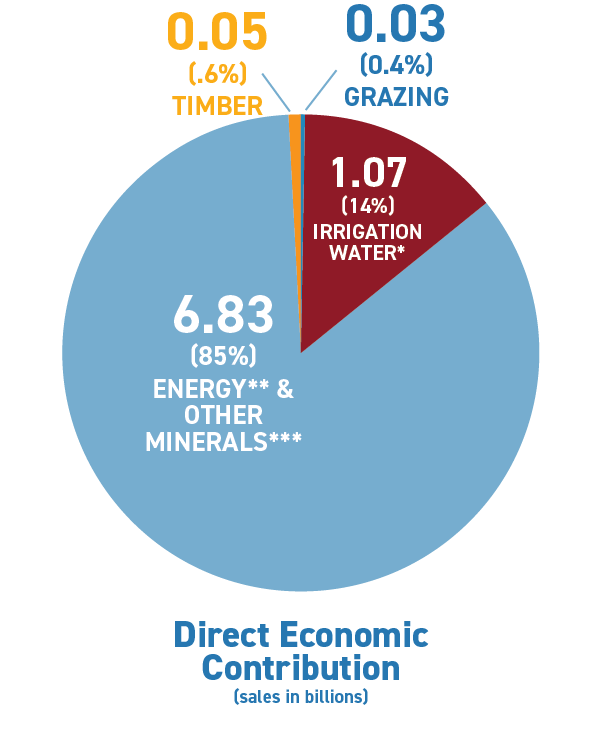
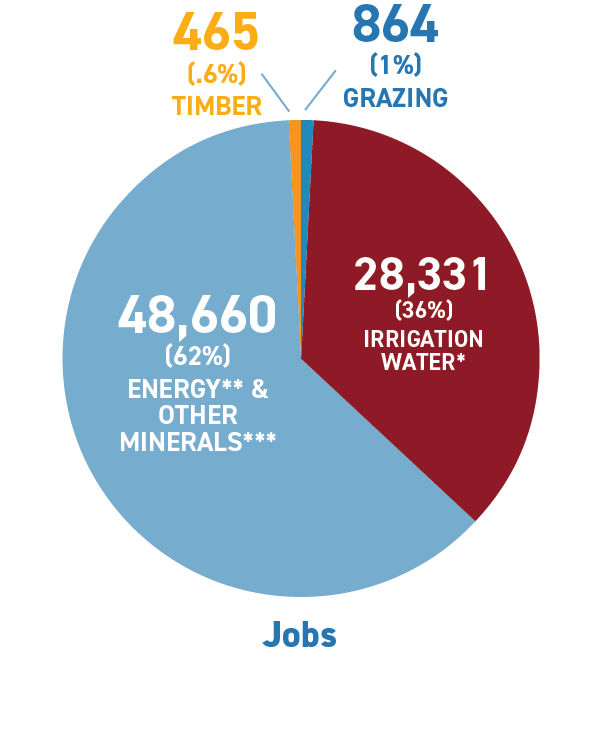
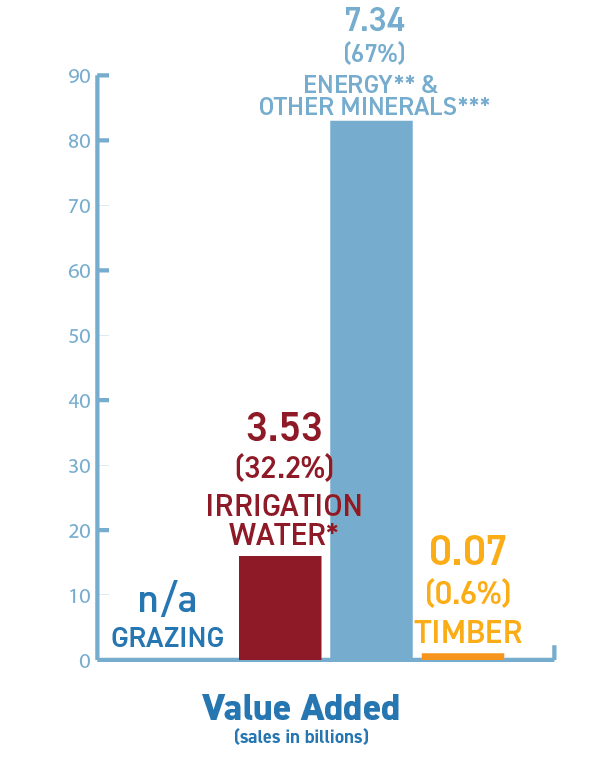
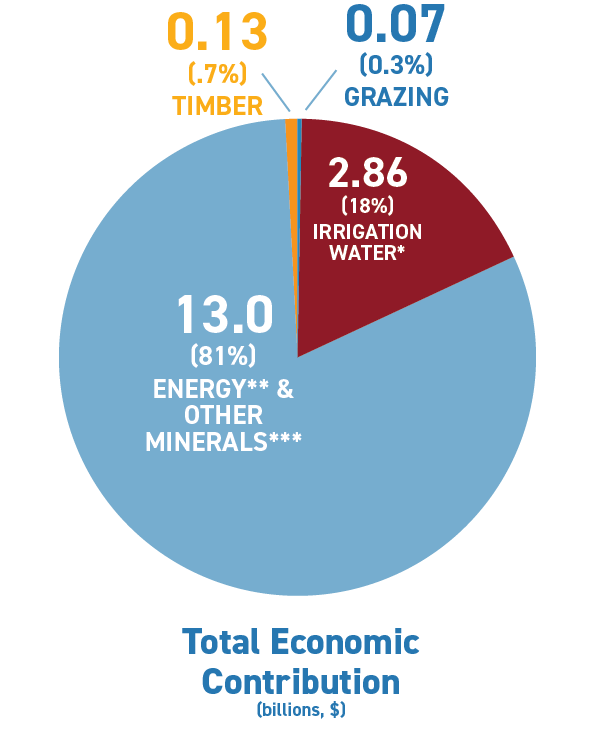
Total Contributions to the National Economy
| Direct Economic Contribution (sales in billions) | Jobs | Value Added (billions, $) | Total Economic Contributions (billions, $) |
|---|---|---|---|
| 7.98 | 78,320 | 9.66 | 16.06 |
*National Economy Includes value of crops and jobs produced from irrigation water
** Renewable Energy Tribal renewable energy production was associated with about $100 million in value added, about $171 million in economic output, and supported an estimated 775 jobs.
*** Sand and gravel or other industrial minerals Tribal sand and gravel production was associated with about $240 million in value added, about $410 million in economic output, and supported and estimated 1,714 jobs.
Source: U.S. Department of the Interior Economic Report, Fiscal year 2019