Tribal Climate Resilience Annual Awards Dashboard

TCR Annual Awards Dashboard displaying data for all awards from 2011-2023, totaling over $119 million. A pie chart breaks down the award amounts by funding category. An accompanying bar chart displays which Tribes and organizations have received the most funding. A map panel shows the location of all awards which you can click on to learn more about each project.
TCR Annual Awards Dashboard displaying data for all awards. A pie chart lists the award amounts by category. A bar chart displays which Tribes received the most funding. A map panel shows the location of all awards.

The Branch of Tribal Climate Resilience (TCR) Annual Awards Program provides financial support for federally-recognized Tribal Nations and authorized Tribal organizations through a competitive funding opportunity to build Tribal resilience capacity.

TCR Annual Awards Dashboard showing a detailed view of the Pueblo of San Ildefonso implementation project to prepare for wildfires.

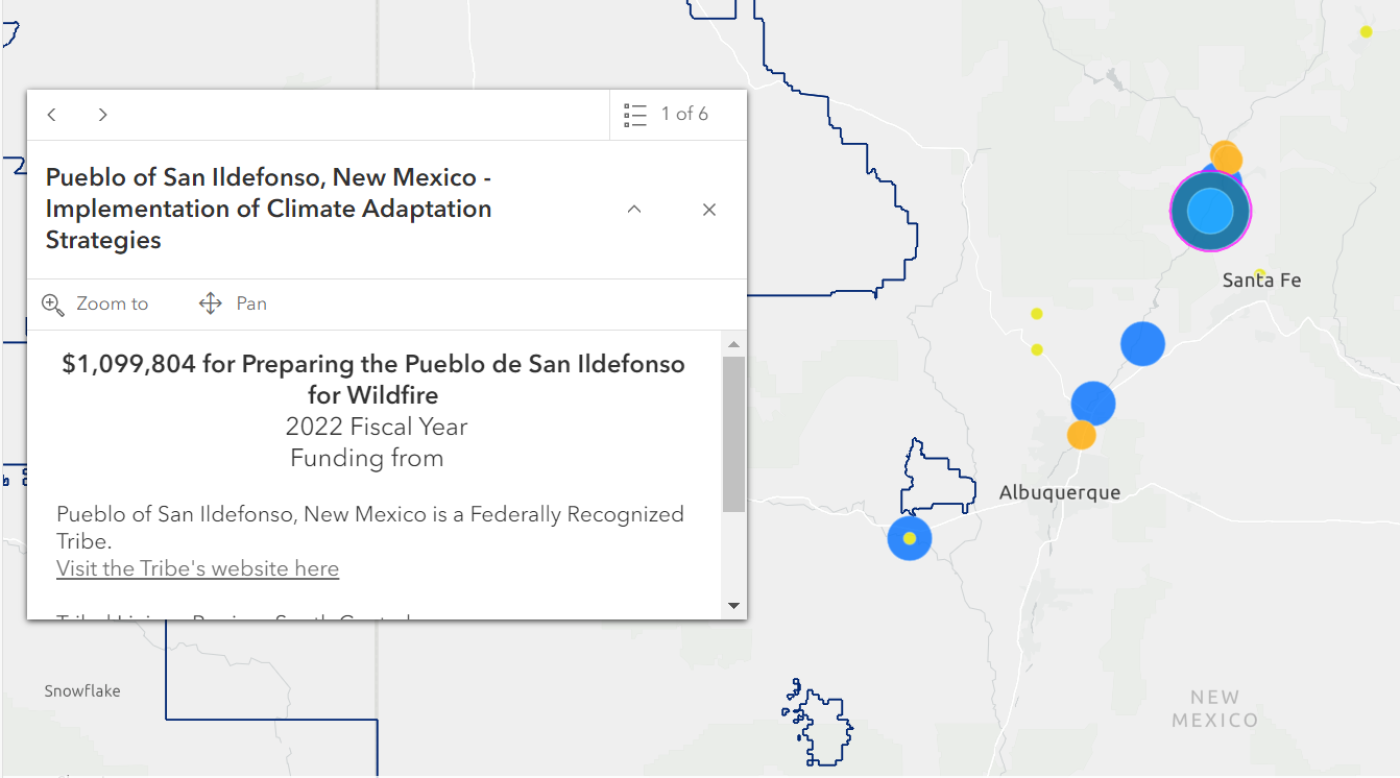
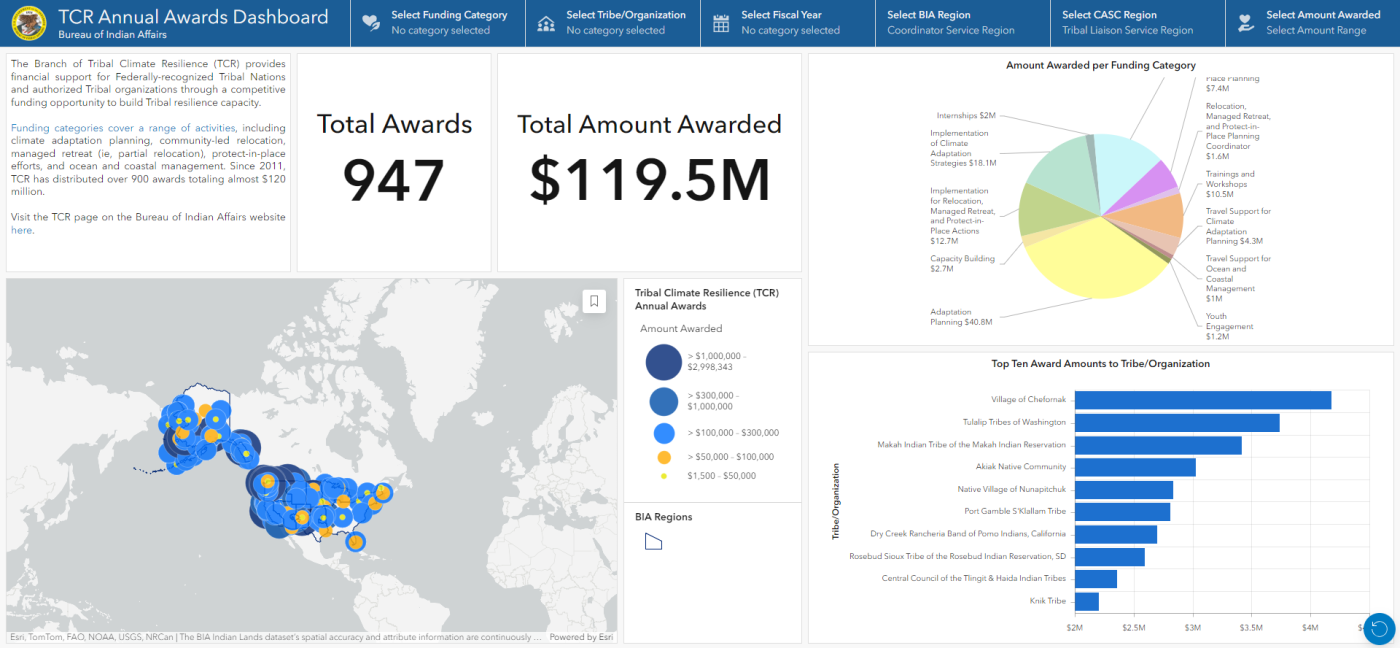
With the TCR Annual Awards Dashboard you can view a map of all annual awards program recipients since 2011 across the US and click on any award to learn more about the project, the Tribe or organization undertaking the project, when the project began, and how much funding the project received.

TCR Annual Awards Dashboard summary panels displaying a pie chart of award categories and bar chart of funded projects by award amount.

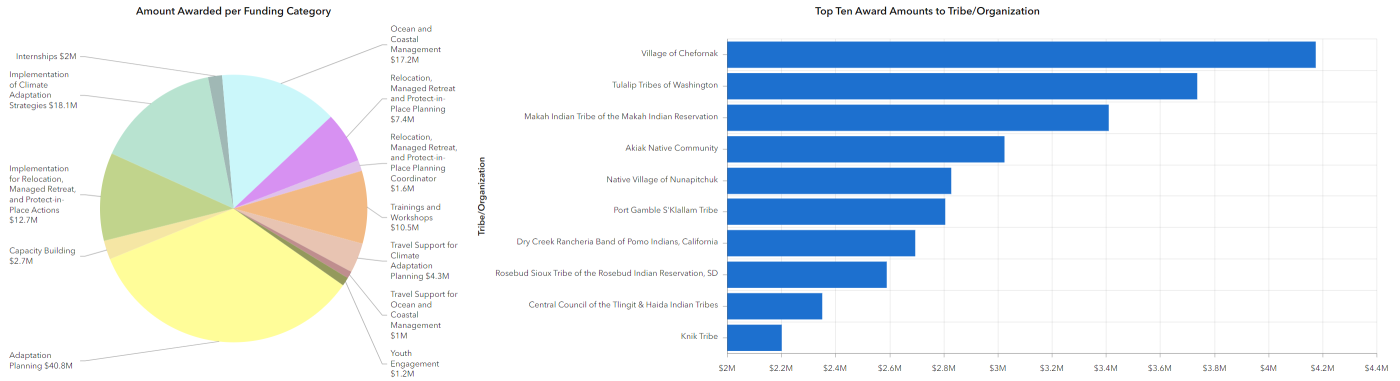
The TCR Annual Awards Dashboard also shows cumulative data on which funding categories have received the most grant money over time, as well as which Tribes or organizations have received the most award funding. 

TCR Annual Awards Dashboard map view showing filter by funding category function.

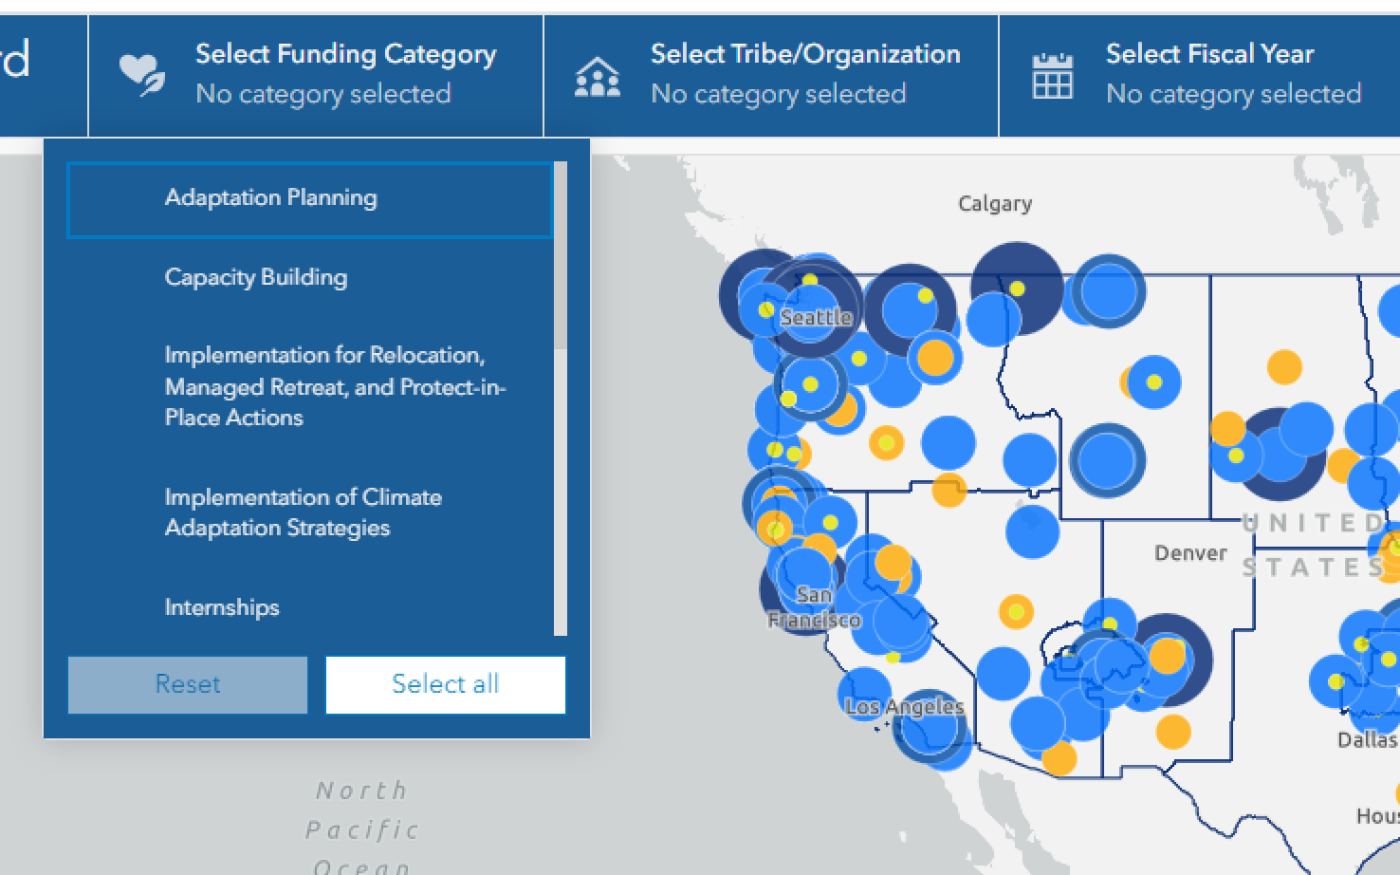
You can also use the TCR annual awards dashboard to search and filter projects that have received awards by what years the project received funding, funding category, Tribe, and region. 

Tribal Climate Resilience Community Driven Relocation StoryMap

Community Driven Relocation StoryMap showing the locations of the 11 demonstration projects funded by the Bipartisan Infrastructure Law and the Inflation Reduction Act for the Native Village of Napakiak, Newtok Village, Quinault Indian Nation, Huslia Village, Native Village of Fort Yukon, Native Village of Nelson Lagoon, Native Village of Point Lay, Chitimacha Tribe of Louisiana, Havasupai Tribe, Passamaquoddy Indian Tribe, and Yurok Tribe.
Community Driven Relocation StoryMap showing the locations of the 11 demonstration projects funded by the Bipartisan Infrastructure Law and the Inflation Reduction Act.

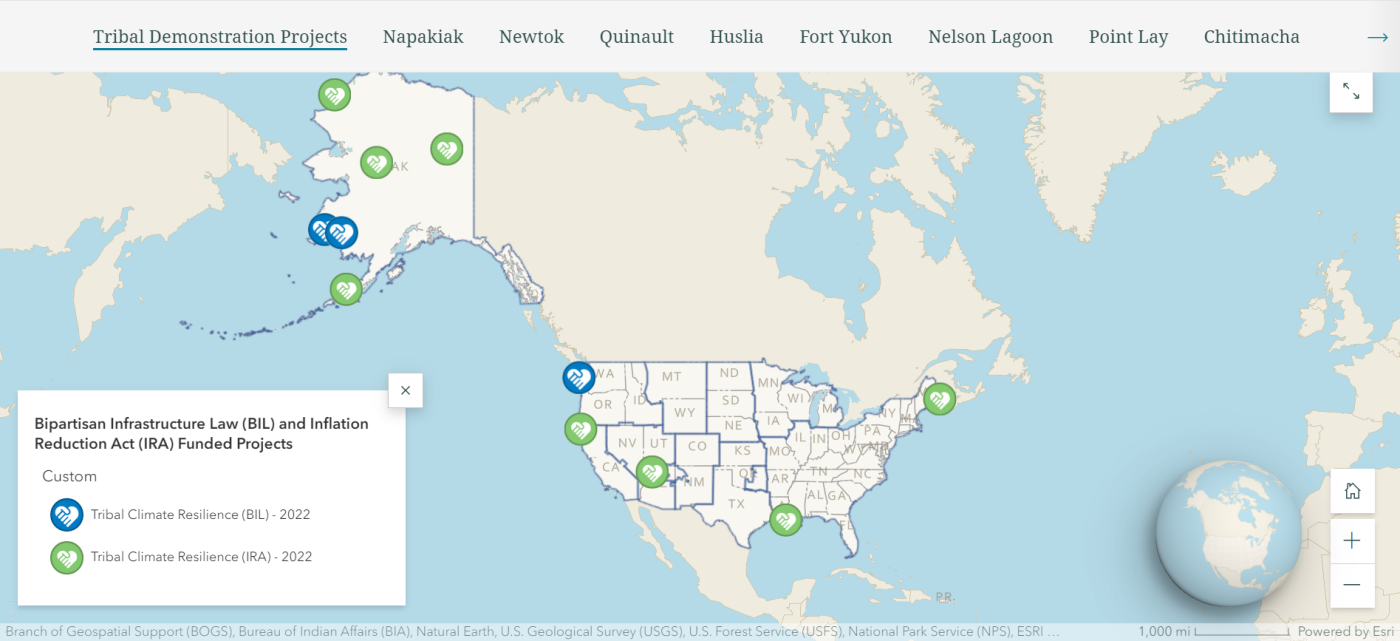
The Bureau of Indian Affairs Voluntary Community-Driven Relocation Program provides funding to Tribes severely impacted by climate-related environmental threats to pursue relocation, managed retreat, protect-in-place efforts, and climate adaptation planning.

Funded with $115 million from President Biden’s Bipartisan Infrastructure Law and the Inflation Reduction Act, the program has supported 11 demonstration projects for severely impacted Tribal Nations. Further support was also provided from the Federal Emergency Management Administration (FEMA) and the Denali Commission.

The Community-Driven Relocation StoryMap includes descriptions of all 11 demonstration projects. You can learn the story of the Tribal community undertaking each project, the climate impacts they are facing, and their plan to relocate, adapt, and prepare for the future.

Environmental Protection Agency Environmental Justice Screening and Mapping Tool

EJScreen displaying climate data for high wildfire risk in Albuquerque, New Mexico. Red areas show parts of western Albuquerque in the 90% percentile for wildfire risk.

The Environmental Protection Agency’s Environmental Justice Screening and Mapping Tool (EJScreen) compiles environmental and socioeconomic geospatial data from public sources into a single tool.

EJScreen supports viewing and layering geospatial data on climate change impacts, such as increased flood risk, wildfire risk, and sea level rise. You can also use EJScreen to combine public data on pollution, socioeconomic indicators, and health disparities to create a complex picture of how environmental injustice affects communities.

On the EPA’s EJScreen web page you can also learn how to use advanced features, review technical documentation, and access the EJScreen API to create custom maps and views.

National Climate Assessment Interactive Atlas

The National Climate Assessment Atlas displaying a color-coded map indicating the change in the number of days over 95°F in the lower 48 US states based on models of two degrees of global warming.

The National Climate Assessment (NCA) is a report mandated by the Global Change Research Act of 1990 and developed through a collaboration of federal and non-federal experts overseen by the U.S. Global Change Research Program.

The Fifth National Climate Assessment (NCA5) was released in November 2023. NCA5 Chapter 16 is on Indigenous Peoples and details the effects of climate change on Tribal economies, health, as well as climate resilience efforts.

NCA5 includes an interactive atlas which provides geospatial information for the climate data and projections used in the report. Available maps include average and peak temperature and precipitation across the US, changes in temperature and precipitation over time, and the number of days each year over various temperature and rainfall thresholds. You can also use the atlas to compare and layer data sets and climate projection models.

Contact Us

Branch of Tribal Climate Resilience
1001 Indian School Rd NW
Albuquerque, NM 87104
8:30 a.m.–4:30 p.m. MST, Monday–Friday.